Introduction to Data Visualisation with a Low-code Platform
What to Expect
Introduction
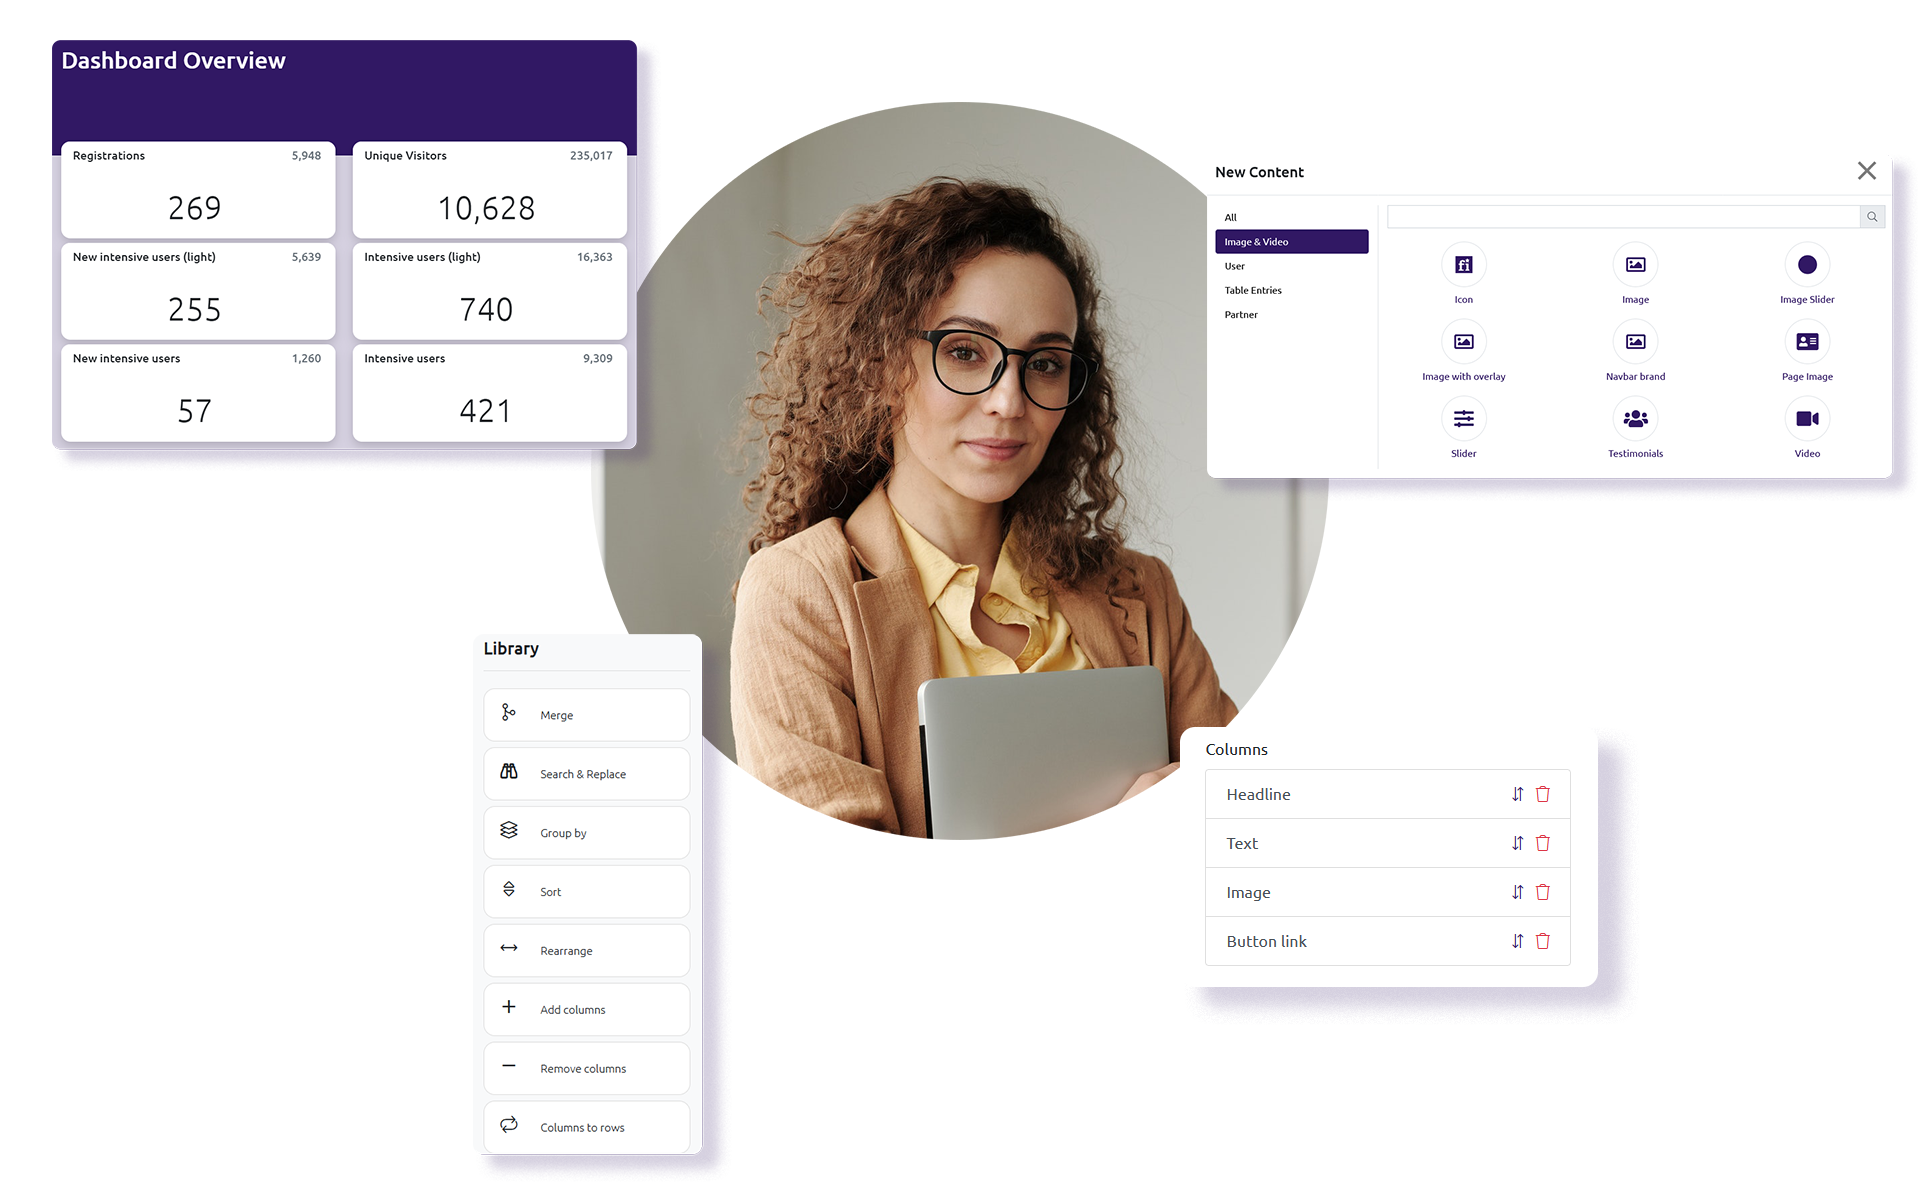
In today's business world, data is everything. The ability to effectively visualize and analyse data can give organisations a competitive edge. But for many businesses, the thought of working with data can be daunting. Fortunately, there are low-code platforms like Kettufy with a drag-and-drop interface that makes working with data much easier - even for those with little to no coding experience.
Here, we will introduce you to the basics of data visualisation with a low-code platform. An overview of what data visualisation is and how you can use a low code platform to create your own customised visualisations that will help you better understand your data - and make better decisions for your business. So, let us get started!
What is Data Visualisation and its Purpose?
Data visualisation is a process that makes data easier to understand and comprehend, allowing information to be conveyed in an interactive, graphical representation. The visual representation of data can be in the form of easy-to-read graphs, charts, maps, or diagrams, which are more effective for interpreting complex data.
Visualizing data can be an important strategy for data analysis to gain a better understanding and insights into your business. It allows individuals and organisations to quickly identify valuable data points sequenced with meaningful representations.
With the advent of low-code platforms, data visualisation has become easier than ever before. Through low-code data visualization tools like Kettufy, users can create visuals and immersive dashboards that promote decision-making without confusion, complexity, or long reporting cycles. Data visualisation is now fast and easy for anyone to do, even if they do not have coding skills or deep technical knowledge.
By employing a low-code platform like Kettufy, data visualisation can help generate greater business visibility, foster quicker data-driven decision making and facilitate smarter strategic planning.

Why Use a Low-code Platform for Data Visualisation?
Data visualisation plays a key role in helping to make sense of large data sets and complex information. However, the traditional process of constructing sophisticated data visualisations using traditional programming languages can be difficult and time-consuming.
Features such as drag and drop capabilities, zero setup and user-friendly interfaces make Kettufy low code platform an ideal choice for data visualisation projects as it does not require extensive development experience. Not only does it provide a simplified programming environment with user-friendly graphical interfaces, but it also requires less maintenance while still providing powerful tools to present data in attractive and informative ways.
By using a low code platform for quick and intuitive dashboard creation, organisations can produce high-quality data visualisations easily whilst still maintaining control over their data models. This is even more helpful when multiple departments need to rapidly create dashboards that are consistent across an organisation. In addition, the Kettufy platform makes it much simpler to develop data visualisations and understand how they were created, providing greater transparency.
Through a range of intuitive applications, customised dashboard visuals and interactive communications tools, businesses can get the most from their data using minimal manual effort. By optimising business operations through increased transparency, improved analytics capabilities, and quicker decision-making, Kettufy's low code for data visualisation makes it clear why businesses should use it.

The Benefits of Using Kettufy Low-code Platform for Data Visualisation
Data visualisation is a powerful tool for interpreting vast quantities of data and transforming it into insightful, digestible insights.
In recent years, the adoption of low-code platforms such as Kettufy for data visualisation has grown in popularity due to its ability to streamline processes and ensure accuracy without wasting time.
Kettufy's low-code platform enables professionals across all roles, from business analysts to software engineers to citizen developers, to create impressive graphical representations with rich interactivity quickly and efficiently. This provides businesses with an effective way to easily create customisable dashboards, graphs, and charts, such as pie charts, bar graphs etc., that can offer strong insight into the performance of the company across various sectors.
Additionally, with a vast library of pre-built components and a simple drag-and-drop interface, Kettufy is more user-friendly than complicated coding languages and allows people from any background or experience level to quickly implement data visualisation solutions.
Further, it allows teams to collaboratively build on data visualisations together as they work towards gaining valuable insights and improving decision-making. Using a low-code platform like Kettufy provides organisations with a scalable solution that can be easily modified as their demands change over time.
Is Kettufy for me?
Check how you can create software solutions without developing skills.

How to Get Started with Data Visualisation with Kettufy Low-code Platform?
Data visualisation is a robust tool for exploring and understanding data and getting started on a low-code platform can be an exciting way to do that.
With Kettufy's low code development platform’s pre-built components and easy-to-use drag-and-drop interface, users do not require any coding skills, making data visualisation much more accessible. From budgeting to sales analysis, the ability to see insights quickly with Kettufy makes it an excellent choice for many business applications.
With Kettufy, the process of setting up a decent visualisation environment is relatively quick and straightforward, with lots of user-friendly components available to help choose the right format and graph type. With its wide range of features and affordable low-code solutions, data visualisation with Kettufy can be an effective choice for uncovering valuable insights in no time at all.
If you are looking for a straightforward way to visually transform your business data, book a free demo today to see how Kettufy can help you achieve your goals.
Examples of Tools and Apps Built Using Kettufy
#1 A Geo Map Visualizing Live Data
Location maps are common knowledge in the Google Maps age. The Kettufy low-code platform allows for the addition of region-based information on top. For the best possible analysis of data on maps, you may also design custom filters.
With our low-code platform, you may precisely create the maps, overlays, and filters that are crucial to your application and increase its value.

Ready to Start Generating Geo Maps Easily and Efficiently?

At Kettufy Discover, you can access tutorials that will guide you through a step-by-step process to create different data and visual elements.
In our Map tutorial, you will learn how to:
- Create a Map.
- Create Lists.
- Use the Geo Data Map component.
- Create Data Sources.
- Create Data Buckets.
#2 Diagrams to Visualize (Company) Data
Nowadays, obtaining data is not a problem; information usually seems to accumulate on its own.
Data may be displayed in a straightforward manner and in a variety of ways using Kettufy.
- Pie charts are a good way to show proportions.
- You can see growth with bar graphs.
- Point charts can be used to display a distribution.
You have a great chance of finding your data gold mine using Kettufy. You no longer need to request something from the development team because you can quickly implement it on your own by using drag and drop.
Imagine having two new charts uploaded to your dashboard every day to provide you with the precise data you require to do your job. This may be done straight now with Kettufy.
#3 An Insightful Representation of (Business) Data
Excel spreadsheets, particularly those used in the corporate world, may develop into real column and row monsters. Massive data sets might become too complicated and difficult to analyse with frequent data collecting. Even the built-in features might occasionally make it challenging to analyse the data collected by third-party applications.
As a result, every year chances are missed as a result of poor internal data analysis and inadequate planning.
Such data amounts may be easily imported into the Kettufy low-code platform to provide an understandable and filter-resistant data representation.
Hence, let our platform present the precise data that your company needs at a certain time for improved decision-making. You will be better able to understand your customers or business as a result of this.

Want to know more about what you can create using the Kettufy Low code Platform? Read in detail about all the small tools and apps built using Kettufy.
Take the first step towards revolutionizing your business with our low-code platform! Schedule a free consultation today to discover how easy it is to create custom software solutions that meet your unique needs. Fill out the form using the button below, and a member of our team will be in touch to discuss your options. Don't wait - start transforming your business right away!
Is Kettufy for me?
Check how you can create software solutions without developing skills.
Bonus Information
What All Can You Build using Kettufy Low-code Platform?
#1 Workflow and Process Management App.
#2 Application for Human Resource Management.
#3 CRM (Customer Relationship Management) Software.
#4 Tool for Asset Management.
#5 Application for Case Management.
#6 App for Healthcare Management.
#7 Apps for Hospitality.
#8 SaaS Development.
#9 Applications for Regulatory Compliance.
#10 Citizen Development with Kettufy.
#11 Omnichannel Endpoints for Core Systems.
Visit the page to learn about everything you can build with the Kettufy low-code platform.
